The City Livery Company for the
Communications and Content Industries
COPYRIGHT IN THE DIGITAL AGE

Chapter 5: Core Copyright and the UK Economy
Introduction
With the emphasis on the cost of piracy to the copyright industries, and the statement that copyright is preventing innovation which could be profitable to the UK economy, the question arises of what the actual economic contribution of the copyright industries to the UK GDP stood at during the research period. The purpose of this chapter is to provide both an estimate and an understanding of the contribution of the copyright industries to the UK economy. This will take the form of original research as well as an assessment of other research available on a range of similar and related principles. Copyright’s role as a balance between allowing access to content and knowledge and providing financial incentives to creators is also demonstrated in its dual role as a legal protection and an economic contributor. Thus, as ever, the balance between these two is vitally important. A greater understanding of the economic contribution of the copyright industries will then lead to a more nuanced view of the necessity of making changes to copyright.
The economic analysis and rationale for copyright is approached from two different perspectives – the incentive and neoclassical approaches.1 Although these approaches diverge sharply in their applications of the basic principles,2 both are based on wealth maximisation and allocative efficiency, ie maximising the profit from copyright works and achieving efficient outcomes. Efficient outcomes are achieved when production is not more or less than demand requires – when they are at equilibrium. Thus, while the economics of copyright and the debate therein are certainly interesting,3 for the purposes of this chapter, the discussion will bypass that debate and focus on the financial and employment contribution of the copyright industries to the UK economy. This chapter will use the guidelines established by the World Intellectual Property Organization (WIPO) in their 2003 ‘Guide on Surveying the Economic Contribution of Copyright-Based Industries’4 to estimate the value of the core copyright industries to the UK economy. It will use then these figures to compare with other countries that have published reports using the same methodology. Furthermore, this chapter will then juxtapose this against
1 Neil Weinstock Netanel, ‘Copyright and a Democratic Civil Society’ (1996) 106 Yale Law Journal 283. 2 ibid 308.
3 For more on this, see Diane Leenheer Zimmerman, ‘Copyright as Incentives: Did We Just Imagine That?’ (2011) 12 Theoretical Inquiries in Law 29; Gregory N Mendel, ‘To Promote the Creative Process: Intellectual Property Law and the Psychology of Creativity’ (2011) 86 Notre Dame Law Review 1999; Ronald M Dworkin, ‘Is Wealth A Value?’ (1980) 9(2) Journal of Legal Studies 191.
4 WIPO, ‘Guide on Surveying the Economic Contribution of Copyright Industries’ (2003) (WIPO Guidelines).
141
a variety of research on the topic of the economic contribution of copyright and creative industries in order to obtain a different view of the value of copyright and creative industries to the UK as well as an understanding of what further research needs to be conducted.
As can be seen in other areas of this thesis, the digital revolution has been of vital importance for copyright users and copyright holders, irreversibly changing the way we interact with copyright materials. In tandem with this change has come a growing interest in copyright – it has come to be seen as more than a legal system providing an environment for creative activities; it is a business asset attracting licensing, investment, trade and transfers for some, and an insurmountable barrier preventing access to information for others. Whatever the attitude one holds towards copyright, it is more than clear that it plays a significant role in the economy of the UK. With the UK being a net exporter of music in 20125 and research since 2004,6 globally ranked in terms of scientific citations,7 and a historically stable presence in international science in 2015,8 as well as being a global player in the publishing industry, it is clear at a glance that the copyright industries are important to the UK economy. It is for these reasons that the author felt an understanding of the value of the copyright industries in the UK would be beneficial in allowing for a greater understanding of the role copyright plays in the modern United Kingdom. Thus, this chapter will use the WIPO guidelines to synthesise the value of the core copyright industries to the UK economy, comparing this both with the findings of other countries that have published WIPO reports, and with other figures produced by the UK government which estimate the value of the ‘creative industries’ in the UK.
In 2003, WIPO published a set of guidelines outlining how to survey the contribution of copyright to the industry of a particular country. This 100 page Guide on Surveying the Economic Contribution of the Copyright-Based Industries9 began with a discussion of previous surveys attempting to achieve the aims of economic analysis, then a legal and economic
5 UK Music, ‘The Economic Contribution of the Core UK Music Industry’ (2012) <http://www.ukmusic.org/assets/general/The_Economic_Contribution_of_the_Core_UK_Music_Indust ry___WEB_Version.pdf> accessed 29 December 2015, 5.
6 Publishers Association, ‘Memorandum from the Publishers Association’, Appendix 20, Select Committee on Science and Technology Written Evidence (2004).
7 ‘The UK is ranked third in terms of the number of citations its research receives, at 11.6% of the global total’: Department of Business, Innovation and Skills, ‘Growth Dashboard: 22 January 2015’ (2015) <https://www.gov.uk/government/uploads/system/uploads/attachment_data/file/396740/bis-15-4- growth-dashboard.pdf> accessed 11 November 2015.
8 Bruce A Weinberg, ‘An Assessment of British Science Over the Twentieth Century’ (2009) 119 The Economic Journal F252.
9 WIPO Guidelines (2003) (n 4).
WIPO Guidelines
142
discussion of copyright, followed by a categorisation of industries which rely on copyright into one of four different types of copyright industries, and a framework and measurement outline for a study which would be created following these guidelines.
In the years from publication to 2014, numerous countries published studies following these guidelines, allowing for easy comparison between the copyright industries of different countries. The UK has never been one of these countries, and has not produced such a study. In 2015, the Guidelines were revised and updated to allow for the changes which had occurred since their original publication.10 However, due to the short length of time from their updating to the end of the doctoral research period, international comparisons were not available for the updated guidelines.
The practice of measuring the contribution of copyright to GDP11 is visible from the late 20th century; the first complete studies were published in the 1970s, in Canada and Sweden.12 The UK published two studies, in 198513 and 1993.14 All the studies (not just the UK ones) showed that the contribution of copyright industries was higher than generally perceived. Many studies attempted to compare internationally,15 but differences in methodology made this difficult. This showed the need for the WIPO guidelines, which allowed for easier comparison internationally via a centrally structured shared methodology. The guidelines list the types of works protected by copyright, the different rights associated with copyright, states that copyright is a property right and discusses the role copyright law plays in balancing productive efficiency, distributive efficiency and enhancing welfare, growth and development.16 The discussion is extensive, and well balanced, but could be considered outdated when one acknowledged the advancements in technology, classification, and distribution that were seen in the time from its publication to 2014. For this reason, they were updated in 2015, but as mentioned, there was insufficient comparative data to use those updated guidelines. Thus, the 2003 WIPO guidelines are the best available comprehensive and widely used structure for analysis of the contribution of copyright industries to national economies and for this reason are the preferred methodology which will be adopted in this study.
10 WIPO, ‘Guide on Surveying the Economic Contribution of the Copyright Based Industries’ (2015 Revised Edition) (WIPO Guidelines).
11 Gross Domestic Product (GDP) is the monetary value of all final goods and services produced in a certain period of time (yearly or quarterly).
12 WIPO Guidelines (2003) (n 4) 10.
13 Common Law Institute for Intellectual Property, The Economic Importance of Copyright (1985). 14 Common Law Institute for Intellectual Property, The Economic Importance of Copyright (1993). 15 WIPO Guidelines (2003) (n 4) 11.
16 ibid 9-25.
143
Copyright industries classifications
Most reports classify copyright industries in a number of ways, in order to distinguish between those industries that rely entirely on copyright, and those that are not as dependent on copyright. The WIPO guidelines categorises copyright industries into four classifications – core copyright industries, interdependent copyright industries, partial copyright industries, and non-dedicated support industries.17
Core
The definition of core copyright industries is relatively clear –
The core copyright industries are industries that are wholly engaged in creation, production and manufacturing, performance, broadcast, communication and exhibition, or distribution and sales of works and other protected subject matter.18
The separation of production and distribution, especially for certain industries (eg newspapers), would be onerous, and is not recommended. The list of core copyright industries given in the guidelines themselves is as follows:
-
a) press and literature;
-
b) music, theatrical productions, operas;
-
c) motion picture and video;
-
d) radio and television;
-
e) photography;
-
f) software and databases;
-
g) visual and graphic arts;
-
h) advertising services; and
-
i) copyright collective management societies19
Within these eight groups, there are then further classifications that allow us to delve deeper into the practical details of these groups. As the focus of the thesis is publishing, the most relevant group here is press and literature, thus it is worth including the breakdown here:
17 ibid 26-35. 18 ibid 29.
19 ibid 28.
144
-
authors, writers, translators;
-
newspapers;
-
news and feature agencies;
-
magazines/periodicals;
-
book publishing,
-
cards and maps;
-
directories and other published materials;
-
pre-press, printing, and post-press of books, magazines, newspapers,
-
advertising materials;
-
wholesale and retail of press and literature (book stores, newsstands); and
-
libraries20
Collective copyright industries (section i).
There is no breakdown of these, most likely because there is very little that could be done to break down CMOs any further. There is, however, a note that it does not include turnover – this is to prevent double counting, as turnover would be accounted for in their relevant sectors.21
Interdependent
The interdependent copyright industries must be defined in relation to the core copyright industries. However, the report chooses not to refer to them as non-core, as this would diminish the two-way communication between core and interdependent copyright industries that allows both to thrive. The definition offered by the guidelines is:
Interdependent copyright industries are industries that are engaged in production, manufacture and sale of equipment whose function is wholly or primarily to facilitate the creation, production or use of works and other protected subject matter.22
This is then further subdivided into core and partial interdependent copyright industries, with core including manufacture, wholesale and retail of ‘TV sets, Radios, VCRs, CD Players, DVD Players, Cassette Players, Electronic Game equipment, and other similar equipment; computers and equipment; and musical instruments.’ Partial interdependent copyright industries then refer to manufacture, wholesale and retail of ‘photographic and cinematographic instruments; management organisations (CMOs) constitute a separate section of the core
20 ibid 30. 21 ibid 31. 22 ibid 33.
145
photocopiers; blank recording material; and paper.’23 The classification of interdependent copyright industries is straightforward – those industries that do not create copyright works, but support, display, distribute or store them, and thus are inextricably linked with the core copyright industries.
Partial
The partial copyright industries do just what they say on the tin – they are industries resting partially on the copyright of their creations. The definition offered in the WIPO guidelines states that
[t]he partial copyright industries are industries in which a portion of the activities is related to works and other protected subject matter and may involve creation, production and manufacturing, performance, broadcast, communication and exhibition or distribution and sales.24
The guidelines also give a list of industries included in this definition:
-
apparel, textiles and footwear;
-
jewellery and coins;
-
other crafts;
-
furniture;
-
household goods, china and glass;
-
wall coverings and carpets;
-
toys and games;
-
architecture, engineering, surveying;
-
interior design; and
-
museums25
The full list given in the guidelines is designed to be exhaustive – it was specifically chosen notto expand it beyond the industries specifically listed therein
23 ibid.
24 ibid 33. 25 ibid 34.
146
Non-Dedicated Support
The definition offered by the WIPO guidelines as to what constitutes the non-dedicated support industries is as follows:
[t]he non-dedicated support industries are industries in which a portion of the activities is related to facilitating broadcast, communication, distribution or sales of works and other protected subject matter, and whose activities have not been included in the core copyright industries.26
Once again, it is a relatively non-controversial and clear definition, and includes retail, wholesale, transportation, and the internet. The link is relatively clear – without sales and distribution channels, copyright industries would have far more difficulty even existing, let alone thriving the way they do now.
Recommended Framework of the Study
The WIPO guidelines state that three things are frequently measured in copyright studies – size of the copyright-based industries as a percentage of GDP, employment, and foreign trade. The guidelines also give instructions on how to obtain information on gross value added (GVA) of particular sectors, which comprises their contribution to GDP. They also point out that, while most data should be available through public accounts, there are sectors and scenarios in which data may have to be obtained by the researcher, through communication with private industry, surveys and other data collection methods. This is important to note when considering comparing results between different countries, as the reliability of privately collected data may not be as watertight as that of public accounts.27
The guidelines provided by WIPO are thorough and comprehensive, and outline a solid structure for creating a study that can be compared with other countries without much difficulty. There are some weaknesses associated with them, notably their age, and their classification of industries into the ISIC Rev 3.1 classifications, but they provide extensive and well-researched guidelines to assess the economic contribution of copyright industries to an economy. They have been used to implement studies in no fewer than 41 separate countries 28 –
26 ibid 35.
27 ibid 36-43.
28 WIPO, ‘WIPO Studies on the Economic Contribution of the Copyright Industries: Overview’ (2014) <http://www.wipo.int/export/sites/www/copyright/en/performance/pdf/economic_contribution_analy sis_2014.pdf> accessed 17 December 2015.
147
a broad range of countries against which a UK study could be compared. These studies have been carried out by multiple countries and in multiple years, stretching from the introduction of the guidelines in 2002 up to 2014. This allows WIPO to publish aggregate and comparative reports which use the latest data available, not just from the ‘00s but also from the ‘10s into the teens, meaning that data can be more easily compared without fear of factors such as the global economic crisis and relative differences in publication dates leading to incongruences in the comparisons.29
The guidelines offer a structured approach with which to measure the contribution of the copyright-based industries to the economy. For example, taking the measurement of a percentage of GDP, the guidelines provide three alternatives:
The relative size of the copyright-based industries can be measured in three ways as a percentage of GDP, namely through:
(1) output or production – where the GDP is viewed as the difference between output and intermediate consumption, ie, the sum of the value added of all industries, firms or establishments, and is compared to the value added of the copyright-based industries. This is the standard way employed in the past surveys on the copyright-based industries;
(2) expenditure – whereby GDP is viewed as the sum of all expenditure categories – personal consumption, gross private domestic investment government purchases, and net exports – and is compared to the sum of all copyright-related expenditure categories; and
(3) income – whereby GDP is the sum total of payments to factors of production organized by companies (primarily labor and capital), and would be compared to the sum of compensation paid to copyright-related labor (ie, compensation to employees through wages and salaries, bonuses and other benefits) plus copyright-related profits that accrue to firms.30
29 ibid; earlier versions were also made available; it is updated on a regular basis. 30 WIPO Guidelines (2003) (n 4) 37-38.
The guidelines were the source of the breakdown of copyright industries into core, partial, interdependent and non-dedicated support industries. For the purposes of this chapter, a study was conducted of the core copyright industries in the UK in 2010-2012.
148
Framework of Thesis Study
The study conducted for this chapter was based on the WIPO guidelines. Thus, as the WIPO guidelines appendix contains a list of the core copyright industries, together with ISIC Revision 3.1 classification codes, this was the starting point for identifying the industries to be included in the study. ISIC is a United Nations Statistical Classification – that is to say, it identifies industries by issuing codes to particular industries, which allows them to be identified internationally. It is the International Standard Industrial Classification of All Economic Activities.31 At the time of publication of the WIPO 2003 Guidelines, the current version of ISIC was rev. 3.1. Due to the passage of time between the publication of the WIPO Guidelines and the study conducted here, the ISIC had since been revised, becoming ISIC rev. 4.32
Data was taken from the UK Annual Business Survey (ABS), which is administered by the UK Office of National Statistics, and collects information on the UK’s non-financial business economy.33 Unfortunately, when published in the ABS, the data used for this study does not use ISIC codes, but rather UK Standard Industrial Classifications (UK SIC). There is a direct correlation between the four-digit ISIC codes and the UK SIC codes, with the first two digits always being the same, allowing for some degree of comparison.
A third classification standard, NACE, however, has a direct correlation with the UK SIC. These two codes have a correlation to the four-digit level. NACE is a European standard classification of economic activities.34 While UK SIC does have some five-digit classifications, these are always
31 United Nations Statistics Division, ‘Detailed Structure and Explanatory Notes: ISIC Rev 3.1’ (United Nations Statistics Division) <http://unstats.un.org/unsd/cr/registry/regcst.asp?Cl=17> accessed 17 December 2015.
32 United Nations Statistics Division, ‘Detailed Structure and Explanatory Notes: ISIC Rev 4.0’ (United Nations Statistics Division, 2008) <http://unstats.un.org/unsd/cr/registry/isic-4.asp> accessed 17 December 2015.
33 Office for National Statistics, ‘Annual Business Survey’ (Office for National Statistics) <http://www.ons.gov.uk/ons/rel/abs/annual-business-survey/index.html> accessed 17 December 2015. 34 Statistical classification of economic activities in the European Community, with the acronym taken from the French Nomenclature statistique des activités économiques dans la Communauté européenne. Eurostat, ‘Glossary: Statistical classification of economic activities in the European Community (NACE)’ (Eurostat: Statistics Explained) <http://ec.europa.eu/eurostat/statistics- explained/index.php/Glossary:Statistical_classification_of_economic_activities_in_the_European_Com munity_(NACE)> accessed 17 December 2015.
149
within the four-digit matched codes. This then makes the conversion a multi-step process, from the WIPO-recommended ISIC 3.1 to the UK SIC 2007 codes that were in use in 2010-2012.
For the purposes of the study conducted in this research project, in order to ensure that an accurate list was maintained, the code comparison was undertaken in three different ways.
The first of these was to use the UN correspondence codes for the ISIC Rev. 3.1 to ISIC Rev 4.0. These ISIC 4.0 codes were then compared to the UN correspondence codes for the NACE 2.0 classification system. This was then compared to the UK SIC 2007.
The second method took the opposite path – ISIC 3.1 codes were converted to NACE 1.0 (equivalent to the UK SIC 2003 codes). These were then directly converted to UK SIC 2007 codes. The two lists of codes were then compared and crosschecked.
The third method was a manual checking of the ISIC Rev 3.1 codes against UK SIC 2007, which was used to ensure that nothing had been missed.
The three lists of UK SIC 2007 codes were then compared and merged to form one master list, ensuring that nothing essential was omitted, nor was anything extraneous included.35
There were several difficulties encountered in compiling this list – firstly, while NACE and ISIC codes are congruent to the two-digit level, the difference between two- and four-digit identifier codes can be substantial, with a four-digit identifier comprising anything from a single percentage of the two-digit parent category up to the majority. Furthermore, even the five-digit codes used in the 2012 Annual Business Survey may, at times, not be specific enough to accurately assess the proportion of the code that falls under the scope of the core copyright industries. The triple verification of relevant categories mentioned above was employed as a method to counteract the difficulties in converting from UK SIC to ISIC. Furthermore, in order to avoid counting an entire category where only a tiny proportion was relevant, codes in which only a portion were relevant were omitted. Lastly, there were some specific categories where data had been suppressed to avoid disclosure. Although the elimination of certain sectors leads to some regrettable under-counting, this was considered preferable to over-estimating the contribution of the core copyright industries. The ABS provides approximate gross value added at basic prices (aGVA), thus the figures provided therein were lifted directly for the purposes of inclusion in the study.
150
35 Appendix I.
Results
The method described above was used in order to obtain figures for the years 2010- 2012. Thus, a comparison can be made between the years. Furthermore, WIPO publishes collective data from the countries which produce reports under the protocols discussed above, allowing for easy comparison between countries. Thus, using the WIPO framework allows for comparison not only with previous years of UK industry figures but also with other WIPO countries for the same period. WIPO publishes collective economic analyses on a regular basis. For the purposes of comparison, this study uses the January 2014 release36 The WIPO comparison documents analyse the data produced by WIPO studies in a variety of interesting ways, of which several can be adapted to include the study conducted for this paper.
Firstly, and most basically, the study conducted for this chapter gave a total value of £86,480 million for the core copyright industries in 2012. As a percentage of GDP, this stood at 6.25% in 2012. This was an increase of 0.8% on the 2011 figure of 6.17%, using the same study framework. In each year, certain figures were not available in the ABS, whether for the purposes of avoiding disclosure, or because the figures were not available, thus the different years are not entirely congruent, but the difference is small – even this limited assessment shows not only that the core copyright industries were a vital part of the UK economy (more than a twentieth of total GDP), but also that they were growing year-on-year. Although the figures for all copyright industries (core and non-core) in the WIPO collected results show that core copyright industries accounted for roughly 50% of all copyright industries, the EPO/OHIM report, discussed later in this chapter, showed that the core copyright industries in the UK were roughly 75% of total copyright income. Adapting this to the UK figures obtained here, the total contribution of copyright industries to GDP could be anywhere from 8.3% to 12.5% of UK GDP.
In using the study conducted for this chapter, one can see that the percentage contribution to GDP of the core copyright industries was increasing year-on-year.
36 WIPO Overview (n 28).
151
The breakdown of GDP can be effected in several ways – the simplest being by industrial code. Through this, one may observe the growth and shrinkage of different industries in the distribution of the core copyright industries, and compare them over the course of the three years studied. From the three charts in figure 2: Percentage of GDP by Industrial Codes 2010- 2012, we can see that there was a change of less than 1% in all three years – the distribution remained almost entirely the same. This is surprising, especially in terms of print and publishing activities.
It is clear from all three graphs in figure 2 that computer programming and related activities were a vital part of the core copyright industries’ contribution to UK GDP, standing at 45% in 2012. However, it is important also not to deny the contribution made by the print industries, which were holding steady at 12-13% of core copyright industry contributions.
Figure 2: Percentage of GDP by Industrial Codes 2010-2012 represents percentage of GDP by industrial code – this is different to the classification offered in the WIPO framework due to the interaction of SIC codes and different categories from the WIPO classifications. It must be noted that by creating graphs using SIC codes certain aspects of different creative industries are merged – for example, category 90 encompasses literary, artistic and other forms of creation. This is a necessary function of the data collection performed for this chapter, as further breakdown of information into different categories was not available. However, it makes it more difficult to compare with the WIPO collected results. An alternative to this will be discussed in the DCMS Industry Estimates section.
152
Figure 1: Percentage Contribution to GDP Figure 2 Percentage of GDP by Industrial Codes 2010-2012
18 Printing and reproduction of recorded media 58 Publishing Activities
59 Motion picture, video and television programme production, sound recording and
music publishing activities
60 Programming and Broadcasting Activities
62 Computer programming, consultancy and related activities
63 Information service activities
90 Creative, arts and entertainment activities Others
Although in some ways it is not an ideal method of assessment, the use of the WIPO guidelines allows for easier comparison with other countries using the same framework. International comparability is an important part of any assessment – knowing what proportion of the UK economy relied on copyright industries becomes even more powerful when we can also compare what proportion of other economies relied on the same frameworks.
153
Comparisons to other Countries
The use of WIPO guidelines on economic contribution analysis allows data to be compared with similar WIPO studies conducted around the world. Even more helpful is the fact that WIPO collects the data from studies into a single document.37 The version discussed here is built on data from 42 different national studies, from a variety of different countries around the world, including developed and developing countries. As the UK did not at the time produce a WIPO- compliant study, only certain parts of the overview could be directly compared with the original data analysis completed for this thesis, but nonetheless, this comparison can be beneficial, allowing for discussion of what data has been collected and assessed.
Figure 3: Contribution of Core Copyright Industries to GDP by Country Figure 4: Core Copyright Contribution to GDP
The graph above in figure 3, which is taken directly from the WIPO comparison document,38 compares the contribution of the core copyright industries to GDP in 2012 of the 42 studies collected, with the US sitting in the left-most position, with a contribution of 6.48%. The graph also contains an average (mean) line, which shows that the mean contribution of core copyright
37 ibid.
38 ibid 15.
154
industries to GDP was 2.77%. If we re-form this graph to include the UK figures (figure 4), we can see that the UK sits very firmly above the average, and tends greatly towards the higher end of the graph. Figure 4 contains two average lines, one which matches the graph in figure 3, and another which recalculates the mean with the inclusion of the UK’s core copyright contributions. Falling into place behind only the US in terms of percentage contribution to GDP, the UK’s creative industries were at the time one of the strongest contributors to a national economy among the studies conducted through the WIPO framework. Given, however, that the WIPO studies looked at only a select number of countries, this information must be taken into account as part of a selection of countries which did not all have a similar economic structure to the UK. A comparison with other EU countries along similar lines can be seen later in this chapter.
There are certainly limitations to the WIPO methodology, but it is still a comparison which allows us to see that the UK is very strong in terms of copyright contribution to GDP, and thus this should serve as a reason to carefully consider anything which would change the landscape of copyright industries – research into whether and how certain changes would impact on GDP
155
USA United Kingdom Panama Autralia St Lucia St Kitts/Nevis Hungary Netherlands Canada Finland Romania Philippines Korea Singapore Argentina Slovenia Tanzania China Croatia Latvia Malaysia Lithuania Bulgaria St Vincent Lebanon Russia Kenya Thailand Grenada South Africa Bhutan Colombia Jamaica Mexico Ukraine Jordan Trinidad and Tobago Pakistan Dominica Peru Indonesia Brunei Malawi contribution as well as employment should be conducted and verified before any changes are made.
Other Research
Copyright has been studied from an economic perspective for many years – Arnold Plant’s study in the 1930s is just one early example of this.39 Plant did not stand alone, with much other journal and textbook literature available on the economics of copyright and other IPRs.40 Considering copyright as an economic force allows us to synthesise the value of industries that are concerned mostly or wholly with copyright, and estimate the contribution of those industries to economic performance indicators such as GDP, employment and trade. In 2009-2015, much research was conducted on the economic impact of the copyright industries. However, there was less research done on how changes to copyright legislation may affect this economic impact. Copyright research was not isolated to the UK, with many countries producing WIPO-guideline-compliant reports, as discussed above. There was also a variety of other reports on the economic contribution of various sectors, including publishing, digital books and the media and content industries. This section of this chapter will concentrate on the research from the late ‘00s and early ‘10s which discussed the impact of digital on and possible future development of the media and content industries, and consider how their combined information could help us to paint a picture of the contribution of the publishing and printing industries to the UK economy in those years. It will also point out some gaps in the research, and make recommendations for what other research should be conducted before copyright legislation is further modified.
Hargreaves Impact Assessments and Oxford Economics Report
As mentioned earlier in this thesis,41 2011 was the date of Professor Ian Hargreaves’ assessment of intellectual property growth in the UK.42 As part of the supporting documentation of the Hargreaves Review, several economic impact assessments (IA) were published.43 These assessed the potential cost saving and growth impact, per annum, of each of Hargreaves’
39 Arnold Plant, ‘The Economic Aspects of Copyright in Books’ (1934) 1(2) Economica New Series 167.
40 See, for example, William Landes and Richard Posner, The Economic Structure of Intellectual Property Law (Harvard University Press 2003); Richard A Posner, ‘Intellectual property: the Law and Economics Approach’ (2005) 19(2) Journal of Economic Perspectives 57.
41 The Hargreaves Review is discussed many times throughout the thesis. See, for example, the Literature Review.
42 Ian Hargreaves, ‘Digital Opportunity: A Review of Intellectual Property and Growth’ (2011).
43 IPO, ‘Supporting document EE: Economic Impact of Recommendations’ (2011) <http://webarchive.nationalarchives.gov.uk/20140603093549/http://www.ipo.gov.uk/ipreview-doc- ee.pdf> accessed 27 November 2014.
156
recommendations. For many of the proposed copyright exceptions these savings and growth were stated as ‘social innovation’ or ‘not quantified’.44
The quality of these IAs has been subject to some criticism, including by the Oxford Economics Consultation on Copyright: Comments on Economic Impacts.45 This report, which was commissioned by the Alliance against IP Theft (now known as the Alliance for Intellectual Property), analysed the IAs published in support of the Hargreaves Review and pointed out several ways in which the IAs made unsupportable conclusions. The Oxford Economics report pointed out a variety of issues, including lack of net costing,46 faulty assumptions about market size,47 and selection of alternatives where maintenance of the status quo would be more logically beneficial.48
The report concluded by stating that further research was needed before changes could be made, as economic legislation should be based on robust economic research. It also recommended that the status quo be maintained in situations where no convincing evidence could be offered as to the benefits of legislative change. This more cautious approach to copyright legislation was mirrored in the Pricewaterhouse Cooper reports commissioned by a member of the Alliance for IP, the Copyright Licensing Agency which are discussed infra.
Despite the advocacy for caution, the impact assessments in the Hargreaves Review were used to back up several changes in legislation – even as far as the IPO’s annual report in 2014,49 and the same figures were used to estimate the potential for growth in the economy. They also supported the private copying exception which was quashed less than 12 months after implementation.50
Pricewaterhouse Cooper Reports 2011 and 2012
In 2011 and 2012, in response to the movement towards exceptions to copyright law, the Copyright Licensing Agency (CLA) commissioned Pricewaterhouse Cooper (PwC) to produce two studies that considered the economics of copyright, secondary copyright, collective licensing and education exceptions. These two reports, An Economic Analysis of Copyright,
44 ibid 3.
45 Oxford Economics, ‘Consultation on Copyright: Comments on Economic Impacts’ (2011).
46 ibid 11.
47 ibid 13.
48 ibid 26.
49 IPO, ‘Supporting Innovation and Growth: a report on the work of the IPO 2013/14’ (2014), 15. 50 This is more fully discussed in Chapter 6.
157
Secondary Copyright and Collective Licensing51 and An Economic Analysis of Education Exceptions in Copyright,52 were prepared as part of the CLA’s response to the Hargreaves Review and its recommendations for copyright exceptions.
The first report considered the economic rationale for copyright, in that it acts as an incentive to create content – copyright needs to walk the fine line of finding a balance between incentivising creators to continue producing content and allowing potential consumers access to that content. This, however, is not as easy as one might think – as such a balance can be a fragile equilibrium which maximises both consumer welfare and creator incentives. Without one, of course, the other could not continue.
The report analysed the contribution of the core and dependent sectors in the UK, and suggested that they were the largest in Europe, following the WIPO classification guidelines, at 8.4% of GDP.53 It also pointed out the need for further research on the incentive effects of copyright on creators and the scale and value of orphan works. It stressed that these gaps needed to be filled before policy decisions were made.54
The following year, in 2012, the second CLA-commissioned PwC report was published. This focused on the economic impact of the proposed educational exceptions put forward by the Hargreaves Review. It analysed not only the economics of the educational publishing sector, but also the role of copyright in that sector. This is something that many other economic analyses fail to do, often by virtue of the difficulty of disentangling the impact of copyright legislation from the underlying business structures, but it is particularly relevant for educational publishing. Unlike many artistic and creative forms of copyright, educational publishing is less likely to be created as art for art’s sake, and is thus a good test area to investigate the impact of copyright legislation on willingness to publish. The report found that some 54% of the members of the ALCS who are the highest-earners of CLA income, considered secondary licensing and collective licensing (both of which rely on the copyright law framework) to be ‘essential’ and a further 36% indicated that it was ‘important’. For almost 25% of those authors, this represented more than 60% of their income.55
51 Pricewaterhouse Cooper, ‘An Economic Analysis of Copyright, Secondary Copyright and Collective Licensing’ (2011).
52 Pricewaterhouse Cooper, ‘An Economic Analysis of Education Exceptions in Copyright’ (2012).
53 PwC, An Economic Analysis of Copyright, Secondary Copyright and Collective Licensing (n 51) 20. 54 ibid 6.
55 PwC, Education Exceptions (n 52) 2.
158
These two reports, which the CLA submitted to government, counselled of the need for caution before implementing copyright reforms or exceptions, stating that there was a need for greater economic research into the impact of potential exceptions. Ultimately, however, this was not the case, and all of the Hargreaves exceptions were implemented in 2014.56 Two of those exceptions are discussed in more detail in the next chapter.
Statistical, Ecosystems and Competitiveness Analysis of the Media and Content Industries
The Joint Research Council (JRC), the European Commission’s in-house science service, employs scientists to provide independent advice and support to EU policy. As a part of this, under the heading of Information and Communication technology, the JRC conducted a quantitative overview in 2011 of the media and content industries (MCI). Published in 2012, the survey was titled ‘Statistical, ecosystems and competitiveness analysis of the media and content industries.’57 It was composed of a quantitative overview and several sector analyses, including the film sector, music industry, newspaper publishing industry, and book publishing industry.58 All the reports were based on both official (OECD and Eurostat) and non-official data sources, giving great scope to the analysis within.59 It is worth noting that this particular study as concerned with the media and content industries, rather than copyright industries, meaning that information and communication technologies were excluded, as they were subject to their own set of reports. It is also important to note that copyright and copyright legislation was not within the ambit of these reports, and thus they did not quantify the impact of copyright legislation on the industries concerned. The reports produced a profile of the media and content industries for the EU27, the US, Japan, India, and China. The two sub-reports in this series relevant to this thesis on a greater scale – on the newspaper publishing industry and the book publishing industry – each also produced a comprehensive investigation of their relative industries.
56 The Copyright and Rights in Performances (Research, Education, Libraries and Archives) Regulations 2014, SI 2014/1372; The Copyright and Rights in Performances (Disability) Regulations 2014, SI 2014/1384; The Copyright (Public Administration) Regulations 2014, SI 2014/1385; The Copyright and Rights in Performances (Quotation and Parody) Regulations 2014, SI 2014/2356; The Copyright and Rights in Performances (Personal Copies for Private Use) Regulations 2014, SI 2014/2361.
57 Andra Leurdijk and others, ‘Statistical, ecosystems and competitiveness analysis of the media and content industries’ (2012).
58 ibid 18
59 ibid 5.
159
The report in general produced some interesting facts for consideration – such as the fact that the UK was one of the largest markets in the EU27, based on value added, being in the top six for all subsectors.60 It also pointed out that, across the EU, publishing of newspapers was the largest publishing sector, followed by publishing of journals and periodicals. This did not hold true for newer EU Member States though, where books held a higher share of publishing than journals and periodicals.61 Similar to the aforementioned educational publishing report, newspapers were not art published for art’s sake, and relied heavily on copyright to provide financial incentives.
The Book Publishing Industry
Moving on to the book publishing sector, this 2012 report, authored by Jean Paul Simon and Giuditta de Prato,62 broke down the global and European book market by sector, country and type, while analysing its contribution to turnover and employment. The data included in the report covered the period up to 2009, with forecasts being made as far as 2015. It discussed the appearance and impact of digital also, especially the advent of large players like Apple and Google. Parts of the report have become outdated, even in the relatively short time since its publication, including its reference to the Google Books case between publishers and Google.63 The rapid development of digital in the early 2010s led to the rapid obsolescence of much research, and this applies in part to this report. However, it is still useful to provide certain facts, such as the fact that, in 2009, the publishing sector accounted for just under 8% of media and content industries total revenue, at US$109 billion.64 Furthermore, it also noted that book publishing was one of the only industries in which the EU outranked the US, a fact which had remained true for several years.65 However, the report also noted that the US was flourishing in terms of ebook sales, with 57% of global sales in the US.66 It also offered specific statistics on the UK, stating that the UK had 1.5% of the total ebook market in 2009, selling an estimated 763 million books in 2009.67
60 ibid 7.
61 ibid 7.
62 Jean Paul Simon and Giuditta de Prato, ‘Statistical, Ecosystems and Competitiveness Analysis of the Media and Content Industries: The Book Publishing Industry’ (2012).
63 ibid 76.
64 ibid 25.
65 ibid 28.
66 ibid 28.
67 ibid 52.
160
The report concluded by offering a summary – the new players in the book market, including Amazon, Google, and Apple, caused a power struggle in the book industry. It also suggested that digital and print book industries operated on different logics: economics of production in the case of printed books, and economics of distribution for ebooks.68 The report suggested that harmonisation at EU level would help to smooth out these differences and ease the transition into the digital world.69 This suggestion was taken on board at a European level, with copyright harmonisation being a priority for the Digital Single Market strategy.70
The Newspaper Industry
The subsidiary report for the statistical, ecosystems and competitiveness analysis of the media and content industries newspaper industry report was authored by Andra Leurdijk, Mijke Slot and Ottilie Nieuwenhuis.71 It put forward the idea that the newspaper industry, more than the book industry, had been hit by the move to digital.72 While Europe’s was the largest print newspaper industry in the world in 2009, newspaper industries across the EU27 had shown a steady decline since the 1990s.73 The total average circulation per day in Europe dropped by 11 million in the four years from 2005 to 2009 – from 85 million average to 74 million average.74 News consumption was and still is consistently threatened by newcomers to the arena – from radio and television to online news. It is the latter, however, which had the greatest effect on traditional print newspapers. While the majority of people aged 25-65 got their news from television, younger people (14-24) turned to the internet for news.75 Advertising revenue on the internet was in 2009 the fastest-growing advertising segment, which was consequently also affecting newspaper advertising revenues.76
The report considered how traditional newspapers adapted to new challenges, including moving to online, changing format, introducing new sections and magazines, including weekend magazines, offering tie-in exploitation of brand name and integrating more strongly with their commercial possibilities. Legacy broadcasting and newspaper websites remained
68 ibid 89.
69 ibid 92.
70 Commission, ‘A Digital Single Market for Europe: Commission sets out 16 initiatives to make it happen’ (Press Release, 6 May 2015).
71 Andra Leurdijk, Mijke Slot, and Ottilie Nieuwenhuis, ‘Statistical, Ecosystems and Competitiveness Analysis of the Media and Content Industries: The Newspaper Publishing Industry’ (2012).
72 ibid 53.
73 ibid 31.
74 ibid 31-35
75 ibid 42.
76 ibid 62.
161
among the most visited news providers online. Newspapers had also embraced the idea of news apps on tablets and smartphones.77
There were, however, some concerns about the quality of output. While consumers benefit from increased availability of ‘free’ news and the option to tailor news to their preferences, vulnerable news areas, such as investigative journalism and local news, may suffer or struggle to survive.78 While the US had some success with crowd funding and sponsorship, this had not been easily replicated in Europe.79
Measurements of economic health of the newspaper industry in Europe showed a decline in circulation and employment, although not as steeply in the US. It was suffering more than the major Asian markets (Japan and China) though. Language and cultural differences mean that a single European market seems unlikely, which in turn means that intra-European trade will likely continue to be only a niche market catering for business people, expats, etc.80
According to the report, newspapers were undergoing a transitional period, in which they were forced to adapt to new business models as their legacy business declines. New players entered the market, from news aggregators like Yahoo! News and Google News to online-only content creators, and they were able to adapt faster than legacy newspapers, which still needed to support their traditional business models. Consumer behaviour changed, and advertising revenues declined for legacy newspaper printing. However, there was still not sufficient data to comprehensively assess that transformation and its subsequent effects, and thus more data is required in order to understand ‘whether journalism will be able to continue to fulfil its democratic functions.’81
Rüdiger Wischenbart
Rüdiger Wischenbart, a content and consulting firm based in Austria, is responsible for the annual publication of the Global eBook Report. The organisation specialises in publishing and international markets and is responsible for not only the Global eBook Report but also a statistical survey of publishing markets for the International Publishers Association (IPA), and the Global Ranking of the Publishing Industry. The Global eBook Report, authored by the titular consultant, in combination with Carlo Carrenho (Brazil), Javier Celaya (Spain), Veronika Licher
77 ibid 53-68. 78 ibid 57.
79 ibid 66.
80 ibid 78-79. 81 ibid 11.
162
(China), Miha Kovac (Central and East Europe), and Vinutha Mallya (India), which was first presented at the Frankfurt Tools of Change conference in 2011, is updated twice yearly with new data and discussion. The report attempted to map and understand developments in global ebook markets using actual data (not predictions) from a variety of sources and backed up by expert interviews.82
The Spring83 and Fall84 2014 updates of the report focused particularly on the European, US, and UK markets, pointing out especially that Germany was ahead of most of Europe in terms of embracing digital trade ebooks, but still lagged behind the US and the UK.85 The report covered all aspects of the digital ebook market, from the impact of new digital players such as Amazon and Apple to the shifting landscape of legacy print publishers, most notably the merger of Penguin and Random House and how that affected the publishing arena. There were also commentaries on ebook pricing strategies, the divergence between ebook and print book bestseller lists and how infrastructure affected the development of ebook industries – far easier, certainly, to download an Amazon app than to build a network of bookstores.
An interesting point raised by the report was that self-publishers, if taken as a single publishing entity, published more titles in 2013 than any established publishing house.86 The US self- publishing market at that point was estimated at around 11% of total ebook market value, according to Wischenbart, with UK self-publishers holding some 12% of all ebook sales.87
The report also considered flat rate subscription services, a ‘Netflix for books’ idea which had appeared in the previous few years. It gave a short overview of the different subscription models which are available around the world, from Scribd’s branding as a ‘personal digital library’ to Amazon Prime’s bundling of ebook lending with other premium content and expedited delivery of purchases. The subscription costs for all of the services discussed (eleven in total) were extremely low, at around $10/€10 per month – this then would make it challenging for publishers to earn revenues to support themselves.88 The relative youth of those developments meant that the report could not assess their future impact, but it is worth noting that the variety of
82 Rüdiger Wischenbart and others, ‘Global eBook: A report on market trends and developments. Update fall 2014’ (2014).
83 ibid.
84 ibid.
85 ibid 31-34. 86 ibid 107.
87 ibid 108.
88 ibid 111-115.
163
subscription services and their popularity for other media formats meant that it seemed likely that they would be here for some time yet.
Wischenbart, the lead author on the Global eBook Report, also presented a White Paper at the Frankfurt Book Fair 2014, as part of a panel on publishing trends and statistics.89 This White Paper differed from the previously discussed Global eBook Report in that it did not focus solely on ebooks, but instead considered publishing as a whole. The statistics it presented were comprehensive and painted a picture of an industry that had been affected by the shift to digital and thus underwent a transformation.90 However, it is important to note that such transformation is affected significantly by regional differences. While global players and international consolidation both played a role in the transformation of the publishing industry, the presence or absence of those things in particular territories could have a significant effect. For economies with a growing middle class, such as China, India and Brazil, it stated, publishers could cater to the rising demand for culture and entertainment that appears along with this emerging middle class.91 Furthermore, while the decline in print seems inevitable, a reluctance to embrace digital (as can be seen in the case of France92) may ultimately be detrimental to what was one of the strongest publishing industries in Europe.
The White Paper concluded by offering the suggestion that the publishing industry may become more and more difficult to define as a single separate cultural sector as the demand for culture, entertainment and media grows and merges through the increased availability of subscription- based content streaming.93 One important point offered, though, is that the change to digital and the shifting of cultural norms is not something which will happen in the future – it was happening now, here, and in the present, every day around us.94 This point remains true even into 2015 and 2016 – the changes in copyright do not cease at the end of a PhD research period, and will continue to occur for the foreseeable future.
89 Rüdiger Wischenbart, ‘Global Trends in Publishing 2014: An overview of current developments and driving forces in the transformation of the international publishing industry’ (Frankfurt Book Fair, 7-12 October 2014) <http://www.pik.org.pl/upload/files/Global_Trends_in_Publishing_2014.pdf> accessed 7 January 2016.
90 Wischenbart (n 89) 12. 91 ibid 15.
92 ibid.
93 ibid.
94 ibid.
164
PA Statistics Yearbook
The Publishers Association (PA) Statistics Yearbook is, as the name suggests, an annually published collection of statistics relating to the publishing industry. It claims to be an ‘authoritative analysis and measurement of publishing activity’ in the UK.95 The PA Statistics Yearbook deals only with book and journal publishing, and does not consider its cousins in the newspaper and magazine publishing industry. In 2013, according to the Yearbook, book and journal publishing was a £4.3 billion sector of the UK economy – fully 7% of the creative industry estimates discussed the following section.96 It is important to note that the PA Statistics Yearbook is one of the only collections of data in this chapter that considered the year 2013; thus, it must be considered in isolation from other data. The 2013 Yearbook painted a positive picture of the publishing industry, as an industry which ‘has a strong future in the mixed-mode economy.’97 This is without taking into account the influence on the industry of self-publishing authors, Amazon editions, or new digital-only media companies, as these were not considered by the PA survey.98
The PA Statistics Yearbook provided a wealth of information about the book publishing industry, breaking it down by sector, by type and by export vs home market, all of which is important when considering the size and nature of the industry. Salient points included the growth of digital over the previous five years (digital performance saw a 305% growth in the five years from 2009-2014).99
While the PA Statistics Yearbook is published every year, 2013 was the first year in which journals were considered; the data related mostly to 2011 and 2012. The effect of the introduction of Open Access policies will be seen in the years immediately following. The data included in the survey set a value of £924m on the journals surveyed.100 However, that data constituted only around 70% of the journal industry in the UK. Thus, by extrapolation, it can be assumed that the journal industry was worth more than £1 billion in 2013. Of the data collected, it can be noted that fully 75% of journal subscriptions were digital-only – from this, we can see that the journal publishing industry adapted excellently to the digital shift.101
95 Publishers Association, ‘PA Statistics Yearbook’ (2013), ix. 96 ibid ix.
97 ibid 2.
98 ibid 90.
99 ibid 1. 100 ibid 70. 101 ibid 69.
165
An interesting point noted in the section that discussed English Language Teaching (ELT) was that the concept of the book was rapidly losing relevance. There was a visible move towards flexible, modular learning, which is blended and online.102 The market was able to adapt to this, though, as growth figures for digital showed. In 2013, digital sales in fiction grew by 14%,103 in children’s fiction by 28%,104 in school books by 18%,105 and in ELT by 45%,106 all of which showed that digital offerings were available, and were being taken up by the consumer. Worth noting is that the definition of digital in this instance included digital audiobooks, ebooks, subscriptions, downloads and wholly digital material delivered online.107
The take-away from the PA Statistics Yearbook 2013 was that the UK publishing industry was maintaining value, with growth in digital and steady physical exports largely offsetting the decline in the home physical market.108 This is expected to continue into 2015 and beyond.
DCMS Industry Estimates
In January 2014, the Department of Culture, Media and Sport (DCMS) published their Creative Industries Economic Estimates.109 A comprehensive mapping of what the creative industries and the creative economy are, as well as their contribution to the UK economy, these estimates were the first of what may well become a benchmark of analysing the value of creative content industries to the UK.
These estimates identified the ‘Creative Industries’ in the UK, according to the government’s 2001 Creative Industries Mapping Document110 as ‘those industries which have their origin in individual creativity, skill and talent and which have a potential for wealth and job creation through the generation and exploitation of intellectual property.’ It is important to note that this particular definition did not refer solely to copyright, but to the wider IPR spectrum, and thus its ambit was wider than the WIPO Guidelines. Salient points from the estimates included
102 ibid 53.
103 ibid 25.
104 ibid 41.
105 ibid 47.
106 ibid 53.
107 ibid 90.
108 ibid 13.
109 Department for Culture, Media and Sport, ‘Creative Industries Economic Estimates January 2014 Statistical Release’ (2014) (DCMS Economic Estimates) <https://www.gov.uk/government/uploads/system/uploads/attachment_data/file/271008/Creative_Ind ustries_Economic_Estimates_-_January_2014.pdf> accessed 8 January 2016.
110 Department for Culture, Media and Sport, ‘Creative Industries Mapping Document’ (2001) <https://www.gov.uk/government/publications/creative-industries-mapping-documents-2001> accessed 8 January 2016.
166
that the creative economy accounted for 2.55 million jobs in 2012, which is 1 in every 12 jobs.111 Furthermore, the GVA of the creative industries was £71.4 billion in 2012, which was 5.2% of the UK economy that year.112
The Creative Industries Estimates offered a definition (complete with illustrative diagrams)113 of what the creative industries are, and how they differ from the creative economy as a whole. Simply put, the creative economy is comprised of those people working in creative industries, and those working in creative jobs in non-creative industries (eg self-employed authors, artists, designers, or creative employees working in industries that are not themselves creative). The creative industries are a subset of the creative economy, being those industries where more than a certain proportion of employees are engaged in creative work – ie that they have a high degree of ‘creative intensity’. While the industry must have a proportion of creative work in it, the creative industry designation then applies to everyone employed in that industry – ie for publishers, it also would include administrative staff, not just authors, and editors.114
The economic estimates of the DCMS were provided in three different ways – GVA, employment, and exports of services.115 In doing this, not only did they classify creative industries (using UK SIC 2007),116 but they also classified what they considered ‘creative occupations’ using SOC (Standard Occupational Classifications) codes,117 allowing them to create the intersection between creative industries and creative occupations, and gain a greater view of the creative economy as a whole.
As regards industries, DCMS divided them into nine groups:
-
Advertising and marketing
-
Architecture
-
Crafts
-
Design: product, graphic and fashion design
-
Film, TV, video, radio and photography
-
IT, software and computer services
-
Publishing
-
Museums, galleries and libraries111 DCMS Economic Estimates (n 109) 10. 112 ibid 7.
113 ibid 5.
114 ibid 4.115 ibid 7. 116 ibid 26. 117 ibid 25.


167
Music, performing and visual arts
118
These groups are thematically very similar to those groups used in the WIPO Guidelines.
The estimates gave a variety of interesting perspectives on the economic contribution of the creative industries, including that the creative industries were responsible for 5.2% of the UK GDP in 2012, which was following the pattern of increasing since 2008.119 The estimates also pointed out that employment in the Creative Economy accounted for one in every twelve jobs in the UK, and grew at a higher rate than the UK Economy as a whole.120 The estimates went into further detail, breaking down the data by industry group, and providing comparisons to previous years, showing year-on-year growth. It is worth noting also that DCMS continued to work with the data in the estimates, producing a detailed report on the employment figures, which was published in June of 2014.121 It drilled further down into the data, segregating it by group, by location, and other methods of division, and produced many interesting points, including that one in six jobs in London was in the creative economy, with 2.6 million creative economy jobs in the UK in 2013.122 Similar economic estimates documents were published in January of 2015 and 2016, and they are expected to continue, allowing for more accurate data regarding year on year developments. This continued creation of economic estimates would then lead to a collection of data which could be assessed not only by industry or occupation, but also by year, allowing for further assessment and analysis, and a further understanding of the importance of the creative economy.
118 ibid 25. 119 ibid 4. 119 ibid 7. 120 ibid.
121 Department for Culture, Media and Sport, ‘Creative Industries: Focus on Employment’ (2014) <https://www.gov.uk/government/uploads/system/uploads/attachment_data/file/324530/Creative_Ind ustries_-_Focus_on_Employment.pdf> accessed 11 January 2016.
122 ibid 17.
168
Figure 5: Employment in the Creative Economy shows the breakdown of employment in the creative economy 2011-2012 by group. Publishing as a group was responsible for almost 250,000 jobs in 2011, increasing into 2012. Certainly, these employment figures painted a picture of an industry which was thriving and growing.
169
Figure 5: Employment in the Creative Economy
Figure 6: Changes in GVA Indexed to 2009
Figure 6: Changes in GVA Indexed to 2009 shows the GVA of the creative industries as compared to the UK as a whole. While both show growth, the creative industries grew at a rate which outstripped the wider UK by a considerable margin. The graph takes the GVA of both in 2009 as the 100-point mark, meaning that comparisons are easily made. An increase of 8% for the UK to 2012 is satisfactory economic growth, but the creative industries more than doubled this, showing growth of 22.3% over the three years from 2009-2012. This growth is encouraging and shows a group of industries which were contributing greatly to the UK economy.
Figure 7: GVA of the Creative Industries Figure 8: Contribution of Core Copyright Industries to GDP by Industry (WIPO)
Figure 7: GVA of the Creative Industries shows the GVA of the creative industries broken down into groups over the four years covered by the economic estimates. Every group shows either growth or stability over the course of the four years, with growth visible in advertising and marketing and IT, software and computer services. This is not surprising as the continuing growth of online and digital opened up new advertising revenues and opportunities for digital entrepreneurs. Publishing has shown growth over the four years of £0.4m, which is a 4% growth from 2009 to 2012. This is a robust figure and is reassuring in confirming that the industry is continuing to thrive and adapt to digital.
170
The DCMS industry estimates were split into groups that are thematically very similar to the WIPO guidelines groups. Thus, it is possible to conduct a rough comparison of industry segregation between the WIPO collected results and the DCMS estimates. This comparison
171
123 WIPO Overview (n 28) 13.
excludes copyright collecting societies, as there are no relevant figures for these in the DCMS estimates.
This chart (Figure 8: Contribution of Core Copyright Industries to GDP by Industry), which is taken from the WIPO comparison document from 2014, shows the breakdown of core copyright contributions by industry.123
172
A similar chart, constructed from the DCMS estimates, is visible above (figure 9).
Although the categories differ slightly, for the most part they are directly comparable, with some combinations of categories (eg film, TV, video, radio and photography is one group in the DCMS estimates, whereas it is three categories in the WIPO classifications). Nonetheless, we can still see that there was a disparity between the largest sectors in the collected WIPO results and in the UK figures – this may be due the fact that the UK is a highly developed country, or due to discrepancies in industry labelling, or any number of other reasons. Nonetheless, we can see that publishing was a strong contributor to the UK GDP in these figures also, standing strong at 14%. This is much lower, however, than the WIPO press and literature figure, which stood at 39%. This may be due to differences in classifications, but equally may be indicative of a shift in focus in the UK. Regardless of the reason for the difference in proportion, it is clear that publishing was still a significant part of the UK economy.
The take-away conclusions from the DCMS estimates were that the creative industries in 2013 were a significant proportion of the UK economy in 2012, and were thriving, even in the aftermath of the recession. The contribution of the creative industries to the UK economy was growing both in real and proportional terms, and thus it would be reckless to make changes to the framework that supports these industries without carefully considering the consequences.
Contributions to GDP by Industry
173
Advertising and marketing
Intellectual property rights intensive industries: contribution to economic performance and employment in the European Union
In 2012, the European Patent Office (EPO) and the Office for the Harmonisation of the Internal
Market (OHIM) published a joint report124 estimating the contribution to economic performance and employment of all intellectual property intensive industries throughout the European Union.125 The report aimed to provide a ‘broad, credible assessment of the combined contribution of industries that make intensive use of the various types of IPRs to the economies of the EU as a whole and of the individual Member States.’126
The report covered several types of IPR – patents, trademarks, designs, copyright and geographical indications. The methodology used for the study in the identification of copyright- intensive industries was an adaptation of the 2003 WIPO methodology.127 That methodology was adapted by the US in its 2012 US Patents and Trademarks Office (USPTO) study, Intellectual Property and the US Economy: Industries in Focus.128 The US study modified the WIPO-defined core copyright industries by removing the distribution element, in order to bring the copyright industries assessment in line with their patent and trademark industry classifications. As the EPO/OHIM study aimed for comparability with the US study, it followed the same methodology when analysing copyright-intensive industries. However, the study also included in an appendix the results that were obtained using the WIPO methodology, allowing for comparability with both types of publication.129
The EPO/OHIM study found that IPR-intensive industries contributed 26% of employment130 and 39% of GDP in the EU.131 It also found that copyright-intensive industries held a 3.2% share of total employment and contributed 4.2% to total EU GDP.132
124 EPO, OHIM, ‘Intellectual property rights intensive industries: contribution to economic performance and employment in the European Union, industry-Level Analysis Report’ (2013) <http://ec.europa.eu/internal_market/intellectual-property/docs/joint-report-epo-ohim-final- version_en.pdf> accessed 11 January 2016.
125 With the exception of Croatia, which did not have sufficient available data, and was not an EU member at the beginning of the study period.
126 EPO, OHIM (n 124) 18.
127 ibid 42.
128 Economics and Statistics Administration, United States Patent and Trademark Office, ‘Intellectual Property and the US Economy: Industries in Focus’ (2012) <http://www.uspto.gov/sites/default/files/news/publications/IP_Report_March_2012.pdf> accessed 11 January 2016.
129 EPO, OHIM (n 124) 132. 130 ibid 59.
131 ibid 62.
132 ibid 78.
174
The study then further broke this down by Member State, noting that the UK came in above the EU average, with 4.7% contribution to total GDP and 4.1% contribution to employment.133 It provided a table of contribution to GDP and employment of EU27 states using the restricted USPTO methodology, which is reproduced in figure 10: GDP and Employment Shares in Copyright-Intensive Industries by Member State, 2010.
From the chart included directly below here (figure 10), the UK stood sixth in terms of contribution to GDP, and fifth in terms of contribution to employment, both very strong positions. The UK sits firmly amongst those countries relying on creative and copyright industries to provide employment and support the economy.
As mentioned, the reason for using a stricter copyright industry definition was to allow comparability with the US Patent and Trademark Office report of 2012. This report gave a figure of 4.4% GVA and 3.5% employment for copyright-intensive industries in the US.134 The EU as a whole was 0.2% behind the US in this regard, but the UK copyright industries contributed more proportionately in terms of both GVA and employment than the US.
133 ibid 79.
134 USPTO (n 128) 45.
175
Figure 10: GDP and Employment Shares in Copyright Figure 11: Economic Contribution of Core -Intensive Industries by Member State, 2010 Copyright-Intensive Industries
176
The appendix results, which used the unmodified WIPO classifications to produce an estimate of EU copyright industry contributions, are partially reproduced in figures 11: Economic Contribution of Core Copyright-Intensive Industries and 12: Contribution to the EU Economy of Core and Non-Core Copyright-Intensive Industries. These figures are not produced on a country-by-country basis, but only for the EU as a whole. There are two sets of data provided, one for the core copyright industries, and one including all four types of copyright industry, as detailed in the WIPO guidelines and discussed above.
Fig 11: Economic Contribution of Core Copyright-Intensive Industries), which is taken from the appendices of the report, showed a comparison between the USPTO data, as discussed above, and a full WIPO set of data. The discussion in the appendix covered those industries which were included in the USPTO copyright industries, the WIPO industries, and both together – as can be seen in the figure, 31 industries were present in both analyses, two were USPTO-only and 18 were WIPO-only.135 This difference in analysis meant that the numbers given in the report proper are stricter, and thus smaller, than a WIPO analysis, but the inclusion of WIPO-compliant data in the appendix allows for a little more discussion.
Figure 11: Economic Contribution of Core Copyright-Intensive Industries
135 EPO, OHIM (n 124) 132-140.
177
The second table (fig 12: Contribution to the EU Economy of Core and Non-Core Copyright- Intensive Industries) taken directly from the appendix of the EPO/OHIM report provided figures for the EU as a whole in each of the four copyright industries classifications. From this table, we can see that the overall EU contributions to employment came in at 7.8% of EU GDP. This figure, more than a twelfth of EU employment, showed the contribution of the creative and copyright industries to EU employment, and reinforced their position as an important industry in the EU. The next, and final, piece of research which will be discussed in this chapter also considered the creative industries and their role in the EU.
Creating growth: Measuring cultural and creative markets in the EU
The final piece of research that will be discussed in this chapter is the 2014 Ernst and Young study ‘Creating Growth: Measuring cultural and creative markets in the EU’.136 This study, which was commissioned by GESAC, the European Grouping of Societies of Authors and Composers, aimed at analysing the cultural and creative markets in the European Union.
The report analysed the creative and content industries as whole, pointing out that they were the third-largest employment sector in the EU, behind only construction, and food and beverage service activities (ie restaurants and bars) in 2012.137 The study also looked at smaller segments of the creative and content industries, with the most relevant of these to the research topic at hand being newspapers and magazines, and books.
136 Ernst and Young, ‘Creating Growth: Measuring cultural and creative markets in the EU’ (2014) <http://www.ey.com/Publication/vwLUAssets/Measuring_cultural_and_creative_markets_in_the_EU/$ FILE/Creating-Growth.pdf> accessed 30 November 2015.
137 ibid 10.
178
The report included an ‘at-at-glace’ section for each of its 11 cultural sectors. Salient facts for the book industry included that the book industry employed 646,125 people in the EU in 2012,138 and that in 2013, reading a book was the second most common recreational activity declared by citizens in the EU, falling behind only watching TV or listening to the radio, which were classed together.139
The study also looked to the future, pointing out that books were slow to adapt to digital, but growth for ebooks worldwide was forecast to be 30% per year for 2010-2015.140
The same at-a-glance section for newspaper and magazine publishing, which included journal publishing also, gave the figure for employment in 2012 as 483,679,141 which was more than 1.2 million people across both sectors. Total revenue for the newspaper and magazine industry was more than €70b euro, making it the fourth largest of the creative sectors.142 Similar to the Statistical, Ecosystems and Competitiveness Analysis of the Content industries,143 it painted a picture of an industry which was grossly affected by the digital shift, but which was adapting to new content models and advertising revenues.144
The study in general paints Europe as the home of world-class content creators and a market with the potential for great growth. It counsels of the need for strategies to ensure that Europe remains a global leader in the creative economy.145
Conclusion
Given the variety of research and viewpoints put forward and discussed in this chapter, a SWOT analysis will give a clear overview of the situation facing the UK copyright industries. SWOT analysis allows for a discussion of the strengths, weaknesses, opportunities, and threats relating to a particular business or industry. In this case, it allows for a clear overview of the copyright industries and their potential for future growth.
Strengths
The UK’s copyright industries’ contribution to GDP and employment is the fifth-largest in Europe
138 ibid 30.
139 ibid 31.
140 ibid 32.
141 ibid 36.
142 ibid 10.
143 Leurdijk and others (n 57). 144 ibid 38.
145 ibid 18.
179
-
The UK’s core copyright industries’ contribution to GDP and employment is the sixth- largest in Europe
-
English as a native language provides advantages as a lingua franca, making export easier
-
The UK’s book and journal publishing industries were worth £4.3 billion in 2013146
-
The creative industries were worth £71.4 billion in 2012,147 increasing to £76.9 billion in2013 148
-
Newspaper and publishing industries consistently make up 12-13% of creative industries,remaining relatively stable despite upheaval of business models 149
-
On a more global scale, when compared to other WIPO reports, the UK stands in theupper echelons in terms of both employment and GVAWeaknesses
-
The UK is geographically isolated from the rest of Europe, leading to greater import and export costs
-
The UK is relatively small, both in terms of geographic size and population size
-
The UK’s legacy newspaper publishers have been slow to adapt to new, digital publishingmethods, meaning they have not been as profitable as they could have been150
-
Similarly, large publishers can take longer to respond to digital innovations, as they haveto simultaneously support their legacy business models151
-
Certain aspects of copyright law can be seen as blocks to new entrants in the creativeindustries, lessening potential for growth in the UK152Opportunities
-
The UK can capitalise on its strengths in providing creative content to continue to be a global content provider
-
Protection of copyright industries and legacy businesses in this time of change will allow legacy publishers to adapt and thrive
-
Allowing the entry of new, smaller, digital-only companies will make the most of the digital shift
-
Movements towards self-publishing and smaller, niche publishing houses allows greater flexibility for authors and content creators
-
A balance between protecting established businesses and encouraging growth will allow the UK’s copyright industries to embrace the digital shift and continue to grow and contribute greatly to the UK economy146 PA Statistics Yearbook (n 95).
-
147 DCMS Economic Estimates (n 109) 7.
148 Department for Culture, Media and Sport, ‘Creative Industries Economic Estimates’ (2015) <https://www.gov.uk/government/uploads/system/uploads/attachment_data/file/394668/Creative_Ind ustries_Economic_Estimates_-_January_2015.pdf> accessed 11 January 2016.
149 See fig 2.
150 Simon and De Prata (n 62).
151 Leurdijk, Slot, and Nieuwenhuis (n 71).
152 Hargreaves (n 42).
180
Threats
-
The adaptation to digital may be too difficult for certain businesses and segments of the industry – bookshops in particular struggled globally to adapt, with many large chains closing their doors, including Chapitre in France and Borders in the United States
-
Smaller new digital-only companies could be more nimble and quicker to adapt than legacy companies, leading to the demise of more established companies
-
Over-regulation could lead to the strangling of content industries
-
Lack of protection for legacy publishers could lead to a decline in quality of creativecontent
-
Failure to find a balance between encouraging growth and protecting establishedcontent could lead to a decline in the quality, quantity, and profitability of UK creative content and copyright industriesThe conclusions that can be taken from the assorted research presented in this chapter are clear – the creative industries, and especially the publishing industries, were in flux, and adapting to the shift to digital. They consistently made a substantial contribution to the UK economy, and thus should be supported at all levels, from creators to distributors. The implementation of changes or exceptions to copyright law should be carefully considered and supported by strong, reproducible, verifiable research indicating its likely outcomes before implementation. This research needs to be strong enough to comply with the IPO’s standards of evidence for policy- making.153 Even with supporting research, changes to copyright law must be implemented with caution – as the private copying exception showed,154 supporting evidence may not be enough to prevent the quashing of a new exception to copyright law.In 2010-2015, the publishing industries remained profitable, and were producing steady results over a period of years, indicating their stability even in the uncertainty of the digital shift. Thus, the implementation of changes to copyright law without giving the market a chance to adapt to the changes it is experiencing would be premature. The impact of implementing an exception relatively quickly will be investigated in the next chapter, a case study of two of the exceptions recommended in the Hargreaves Review,155 which were brought into UK law in 2014.153 IPO, ‘Guide to Evidence for Policy’ (2013) <https://www.gov.uk/government/uploads/system/uploads/attachment_data/file/388238/consult-2011- copyright-evidence.pdf> accessed 14 January 2016.
154 For more, see the next chapter.
155 Hargreaves (n 42).
181


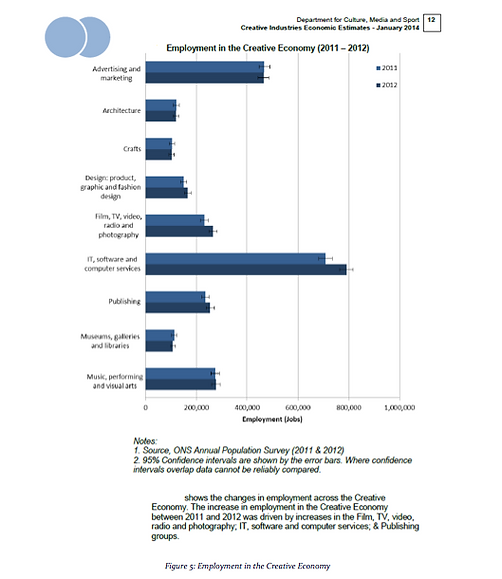


Figure 9: Contributions to GDP by Industry (DCMS)


Figure 12: Contribution to the EU Economy of Core and Non-Core Copyright- Intensive Industries